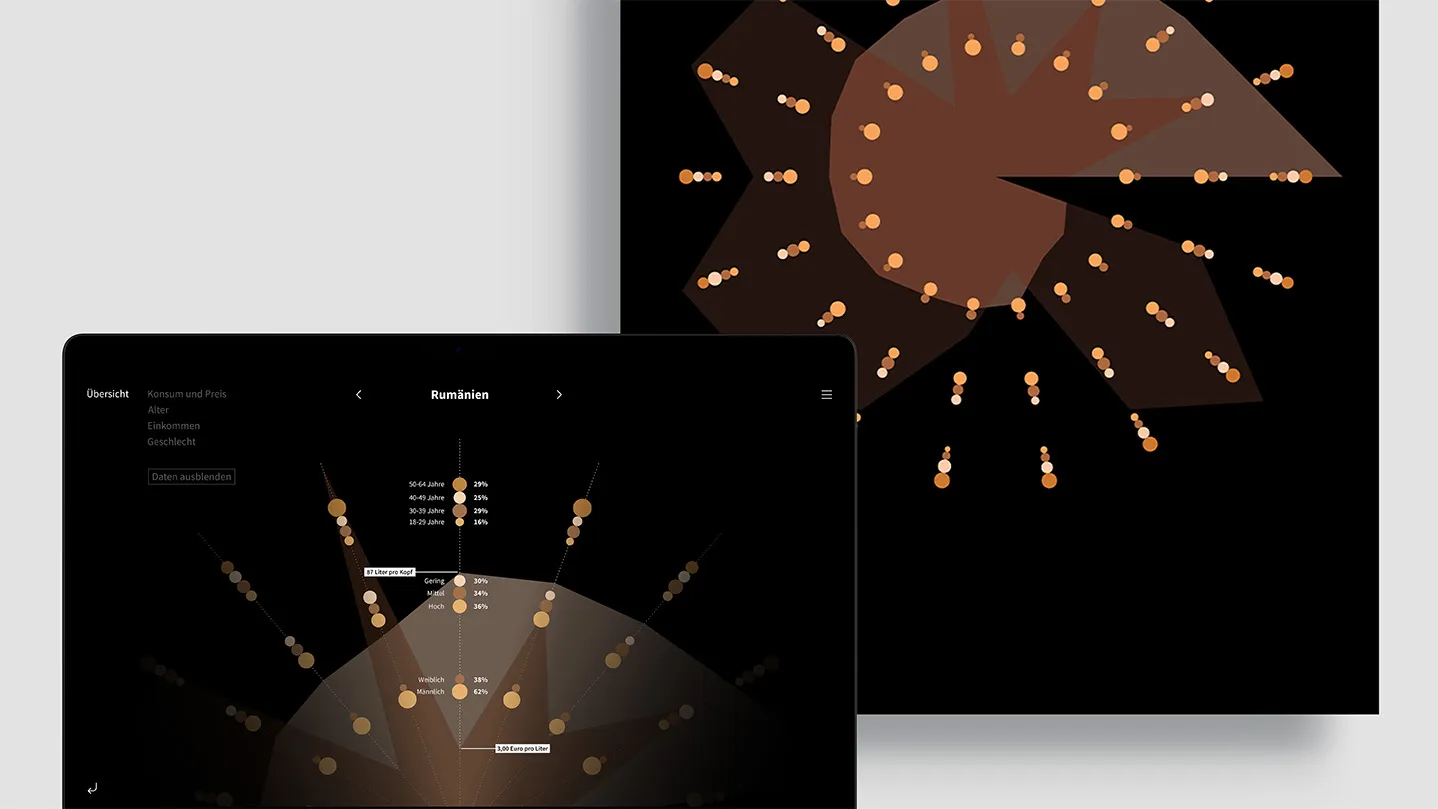
Bridging the gap between abstract data and intuitive understanding through a radial visualization system that functions as both a static poster and an interactive digital prototype.
Created for the "Programmed Design" course at HfG Schwäbisch Gmünd, this project investigates how color and form can organize complex information without letters or numbers. By analyzing beer consumption across 18 countries, the visualization creates a modern aesthetic reflecting the subject while maintaining easy to read data integrity.
Interactive Prototype Project Documentation
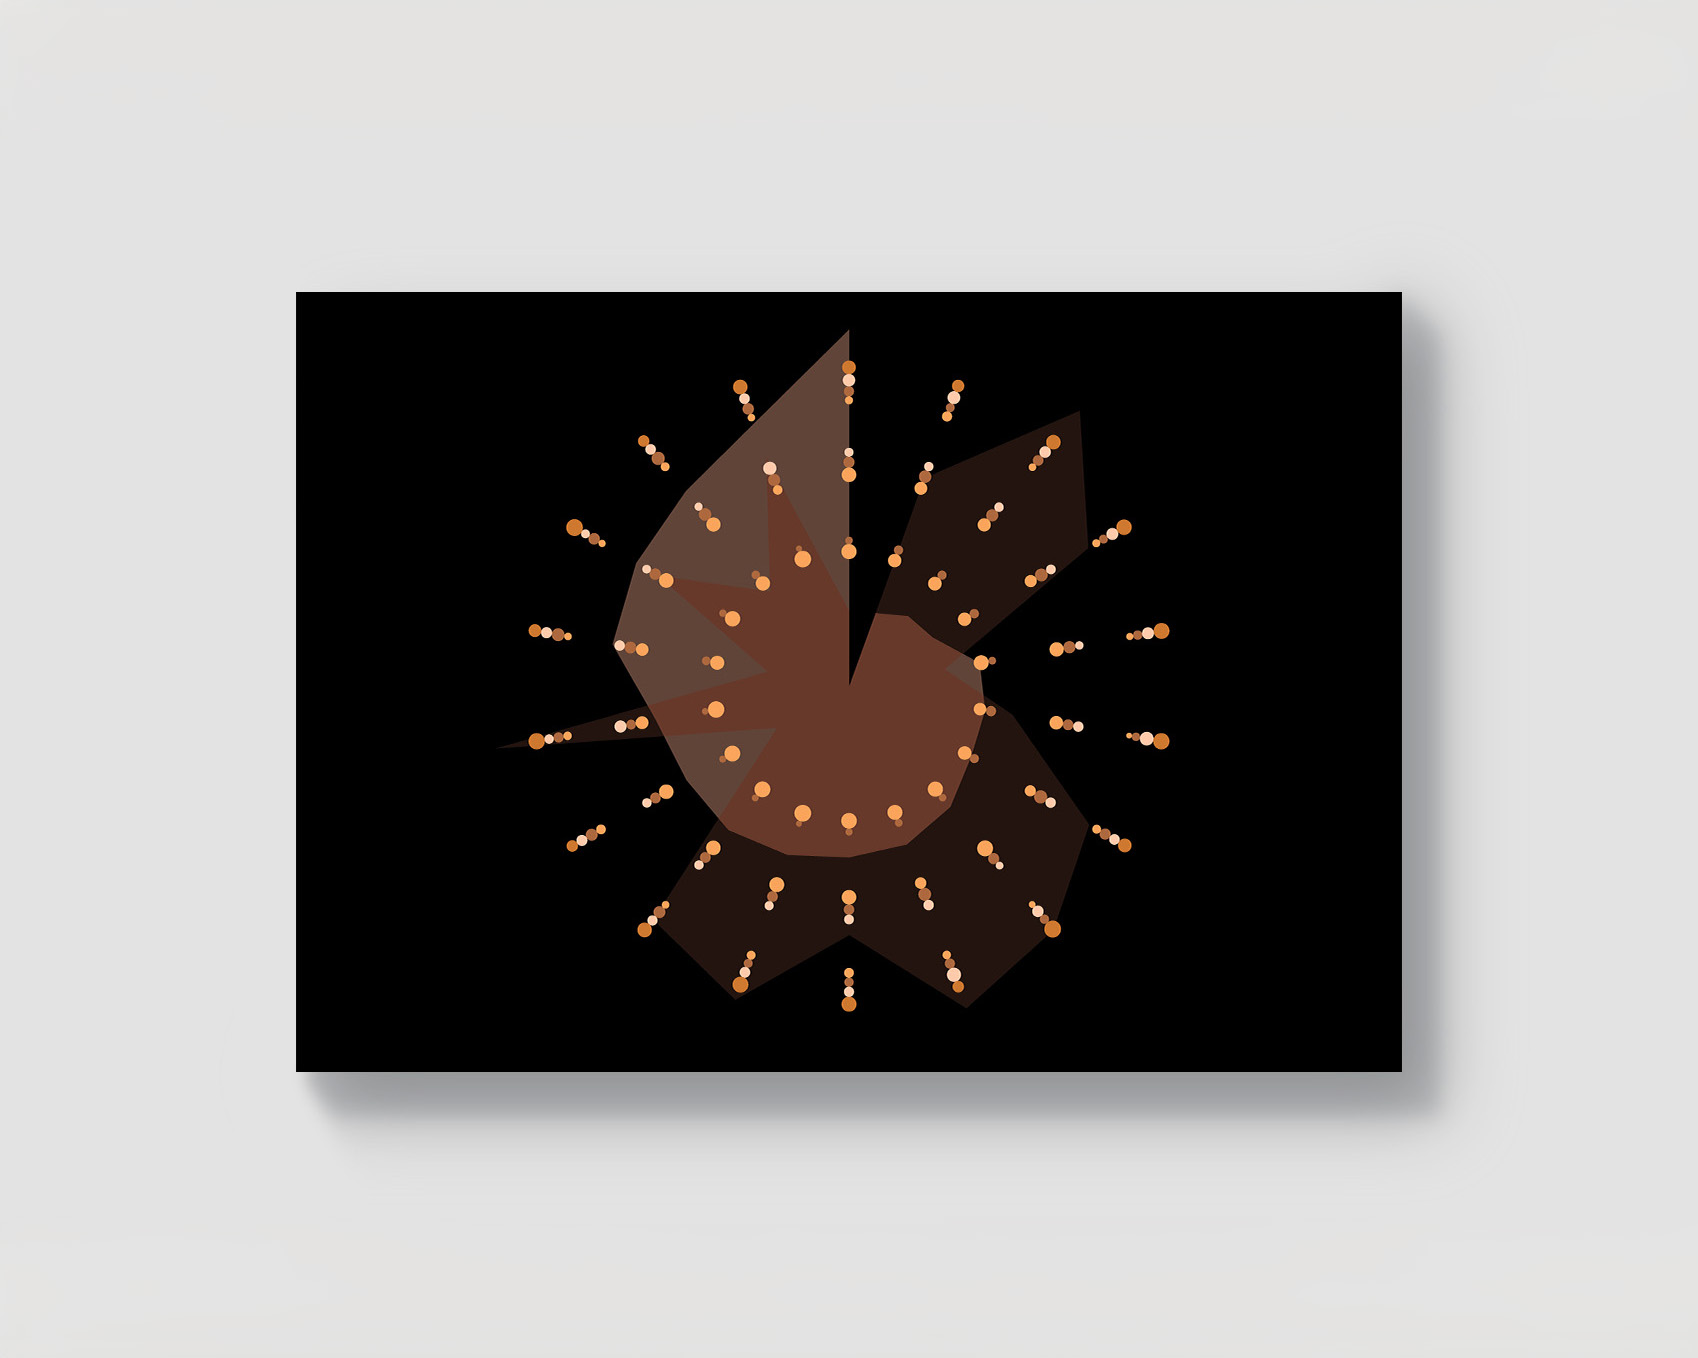
The Challenge
The core obstacle was synthesizing distinct data layers - consumption per capita, price per liter, age, gender, and income - into a visual system. The design required legibility as a static DIN A1 poster while providing depth for dynamic interaction. The impossibility of using text demanded a heavy reliance on geometric hierarchy and associative color theory, which still resembled the chosen topic.
The Process
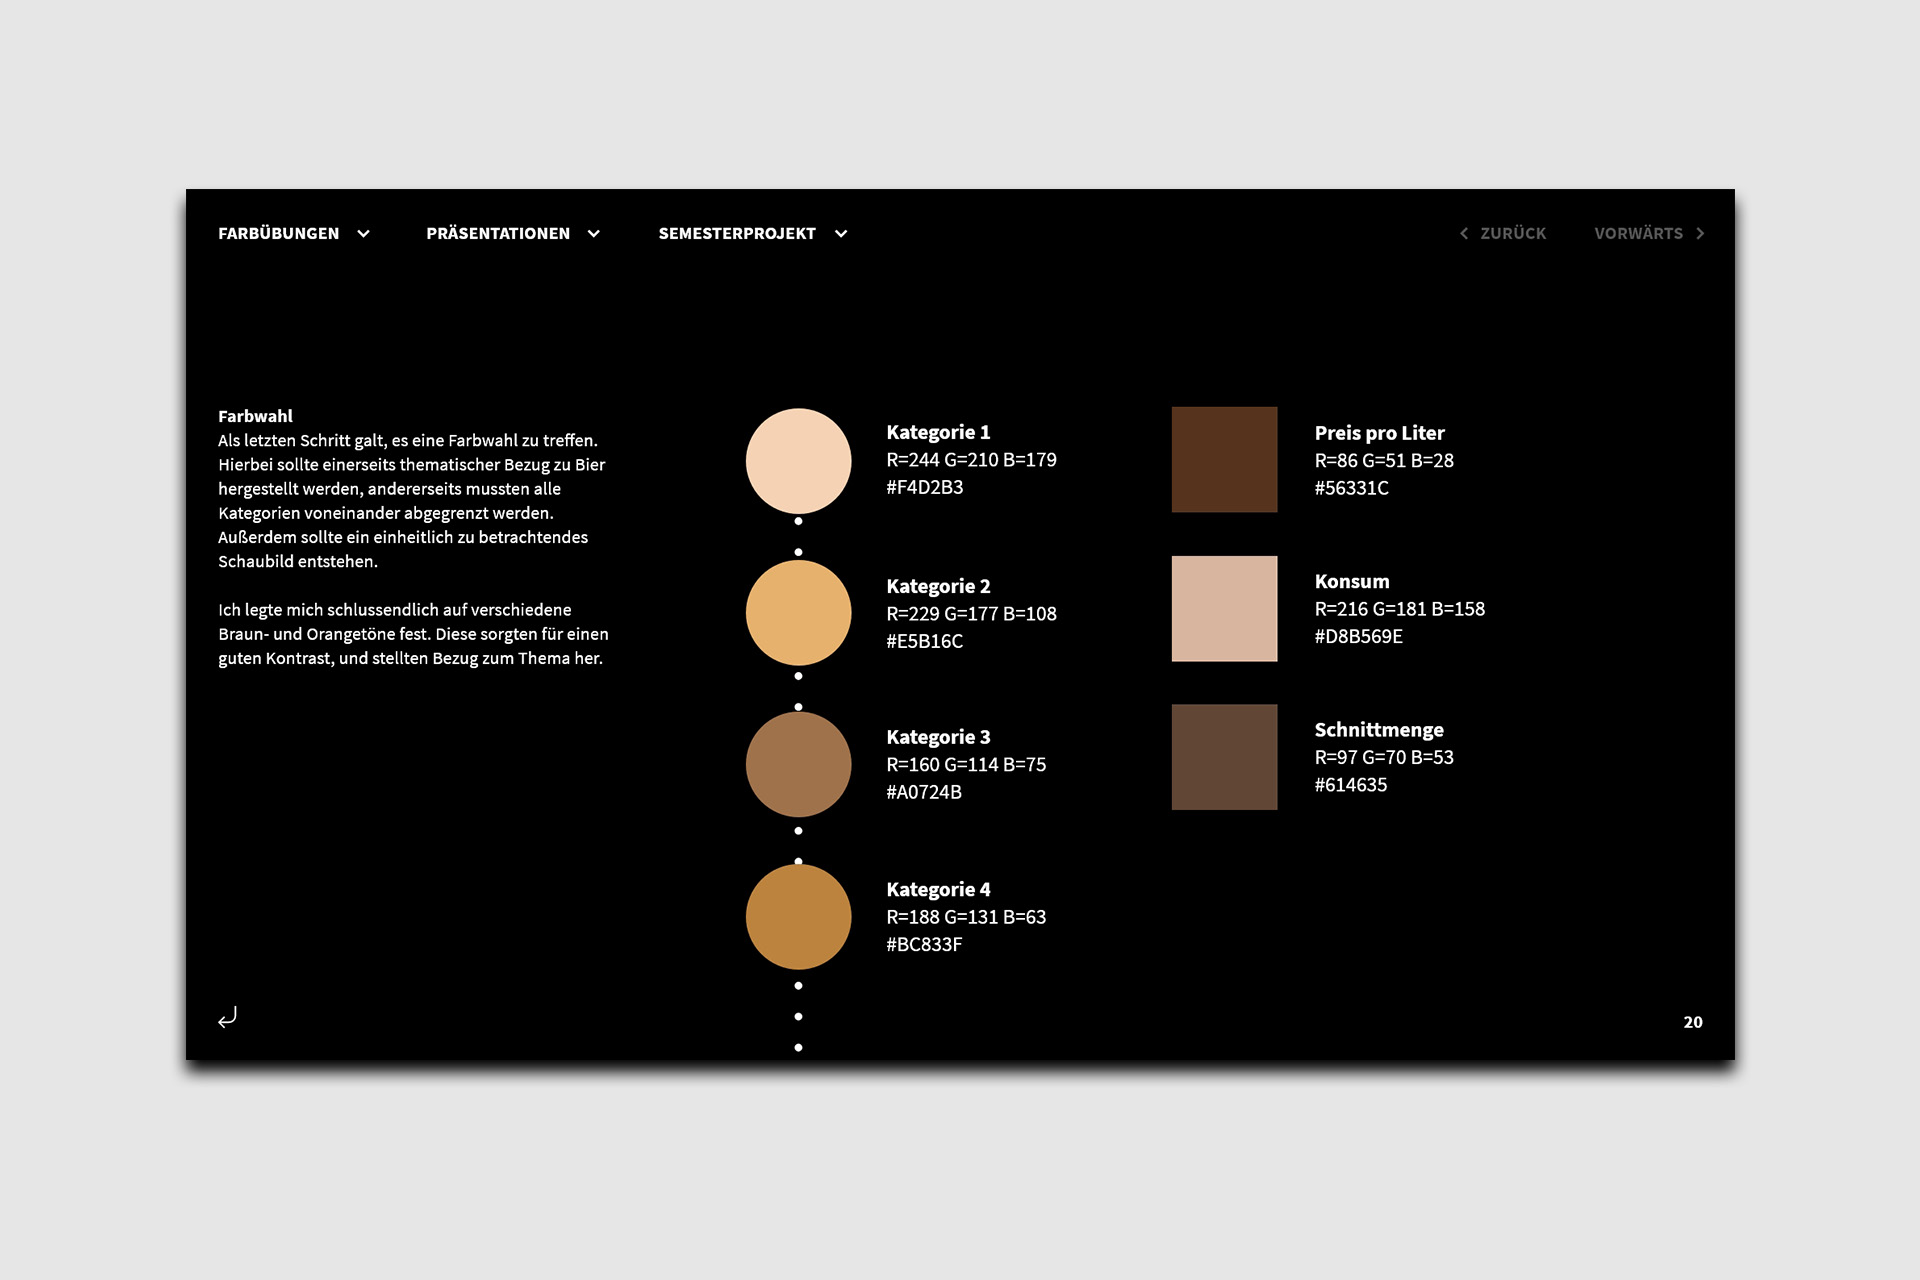
The layout evolved into a radial system, evoking the imagery of bubbles or a top view, looking down into a (beer-)glass. Each country was assigned a 20-degree segment of the circle. Numeric values (liters and price) were mapped to a dotted coordinate system, while categorical demographic data translated into scaled geometric patterns. A color palette of earthy ochres establishes a thematic link to brewing and beer while maintaining visual contrast between data layers.
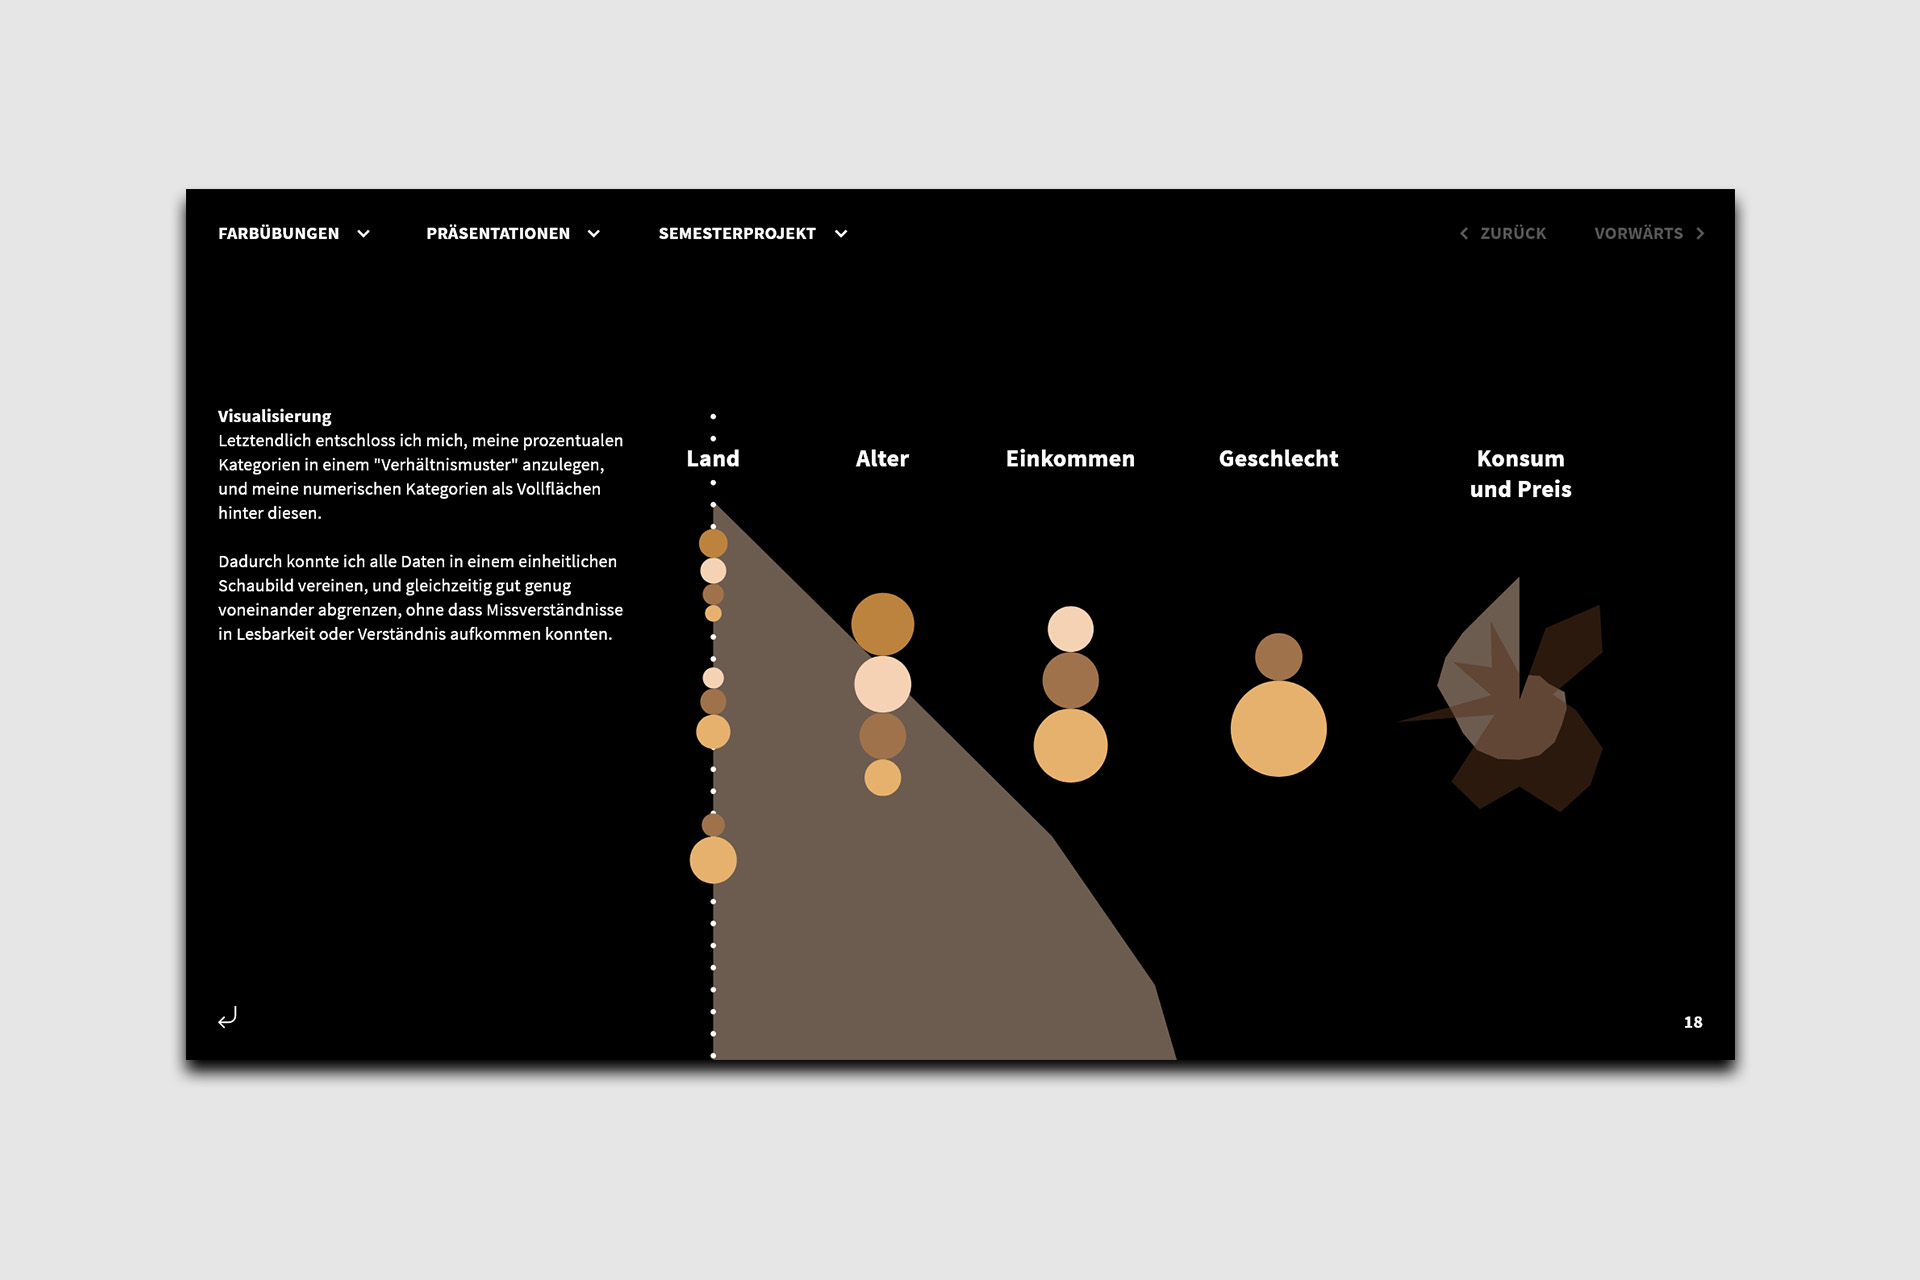
The final output is a dual-media ecosystem. The Static Poster provides a high-level overview, enabling quick global comparisons. The Interactive Prototype allows users to isolate specific data points. The radial graph rotates for fluid navigation to center data points, supported by a menu for direct access. This approach transforms dense datasets into an explorative, tangible narrative.
More Projects